










Compare acquisition and pipeline indicators inside one explicit period and visibility scope.
Before you start
- Choose the period to analyse.
- Confirm source records and visibility are current.
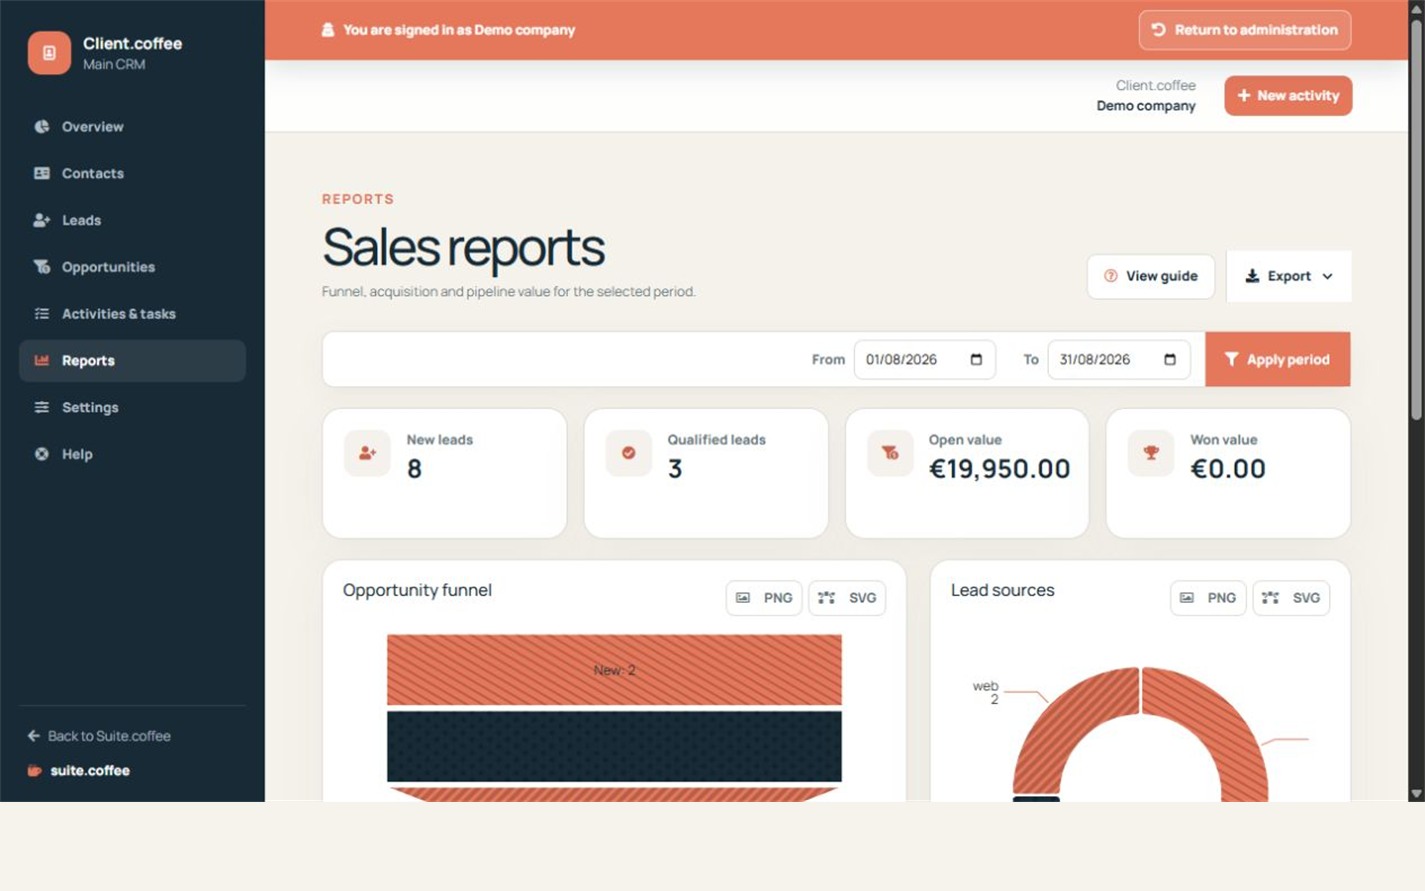
Apply the period first
Reports calculate new and qualified leads, open and won value, funnel stages and lead sources for the selected dates. Screen KPIs, charts and supported exports use that same period.
Respect the visible scope
Results and list exports include only records allowed by the current whole-instance, team or own visibility rule. A downloaded file is a point-in-time snapshot of that scope.
Interpret the funnel operationally
Pipeline values come from opportunity estimates and outcomes, not from Invoice documents or bank movements. Use connected financial context separately when available.
Step by step
- Open Reports.
- Set the from and to dates.
- Review new and qualified leads.
- Compare open and won value, funnel and sources.
- Export only after confirming period and scope.
Final check
- Screen and export use the same period.
- Forecast values are interpreted operationally.
- The file is treated as a point-in-time copy.
Tip: Open the underlying lead or opportunity before acting on an unexpected aggregate.